Understanding Confusion matrix for machine learning in a simple way
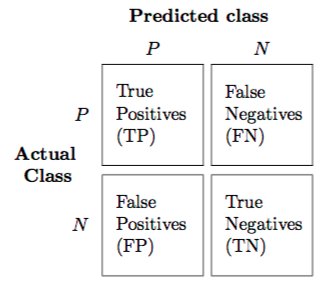 Image : Google Images
Machine learning basic concepts explained as notes from various courses, books and blogs to my understanding.
Confusion Matrix
Confusion matrix as a evaluation metric has been discussed a lot. Indeed, the reason being it’s wide usability and f1-score being a important metric in order to evaluate those classification models. Here we take a look at understanding the confusion matrix in a rather simple way.
Let us assume a dataset with around 40 rows of customer chrun according to a survey from a leading company. The confusion matrix herein will include the matrix of corrected and wrong predictions done on actual labels i.e the outcomes of the preditions on actual labels.
The matrix is represented as :
rows :  Contain actual or true labels in the test set i.e here the labels given by the survey.

columns : Contain predicted labels by the classifier trained on the customer survey dataset.
It is imperative to understand this relation so as to identify how accurate was the prediction done from the classifier.
We are going to see a binary classifcation example.
We know that such evalutaion metrics shows the models ability to correctly predict or seperate the classes. We will be also discussing f1-score here which is also important to learn along with confusion matrix.

The confusion matrix helps you measure some of very important metrics to assess performance of your model like .
- Precision.

- Recall.

- Accuracy and plot ROC-AUC curve too.
Let us first dive into ddefining certain terminologies to better understand the concept of confusion matrix.
- True Positive : Model predicted true and it is correct as per labels.

- False Positive : Model predicted true but it is actually false.

- True Negative : Model predicted false and it is false.

- False Negative : Model predicted false but it is True.

The image clearly illustrates how these values are divided in the matrix.
We will take a look at how to calculate the values for the metrics derived from this matrix(lol, rhyme)
Precision is a measure of accuracy provided that a class label has been predicted.
Precision = True Positive
            __________________________

            True Positve + False Positive
Recall = True Positive
        ______________________________

        True Positve + False Negative
f1-score = 2 X Precision + Recall
            ______________________

            Precision X Recall
Thus, average accuracy can be calculated using average of all f1-scores and the desired values is 1. F1-score can also be used for multi class classifiers.
If you want to learn more you can always refer to Wikipedia for more.
Ashwin Phadke
Computer Vision | Deep Learning
Ashwin has more than 1.2 years of professional and mentoring experience in deep learning, computer vision and NLP.